Duration 1h 22m Project Files Included MP4
Creating and Stylizing Statistical Information in Illustrator
Info:
In this Illustrator tutorial, we’ll be using graphs and charts to visualize data and learning how we can customize them to make them more appealing.
We’ll start by getting familiar with a pie graph and learn how we can enter data into the worksheet to see results in our graph. We’ll then move onto column and area graphs and learn what a data set is and how to translate it into our graphs.
Next, we’ll learn how to get our graph’s legends and labels to look intentional. We’ll also combine different graph types in the same visualization and learn how to format color and type for our graph.
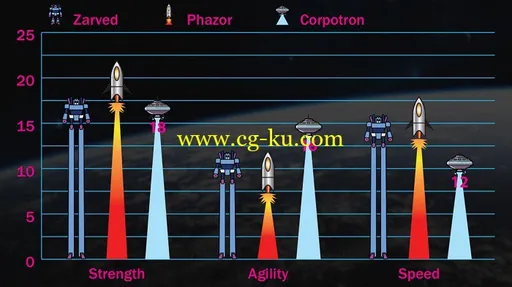
We’ll wrap up this tutorial by learning how to use graphics in place of columns, markers in our graphs and how we can customize the appearance of our graphics to get the best result.
By the end of this Illustrator training, you’ll have a variety of tips and tricks under your belt for the next time you need to add great-looking graphs in your designs.
持续时间 1 h 22 m 项目文件包括的 MP4
创建、 程式化 Illustrator 中的统计信息
信息:
在本插画教程中,我们将使用图形和图表来可视化数据和学习如何我们可以自定义他们,使他们更有吸引力。
我们将开始由熟悉饼图,并学习如何我们可以输入数据到工作表中,在我们的图中看到结果。我们然后将移动到列和地区图,并学习什么数据集以及如何将其转化为我们的图。
接下来,我们将学习如何获得我们图传说和标签的显示方式故意。我们也会组合不同的图表类型在相同的可视化和了解如何设置颜色和类型为我们图的格式。
我们打包了本教程的学习如何使用图形来代替列,标记在我们图和如何我们可以自定义的外观我们的图形,以获得最佳的结果。
这个插画家年底训练,你会有各种各样的技巧和窍门下你的腰带下一次你需要在你的设计添加漂亮的图。