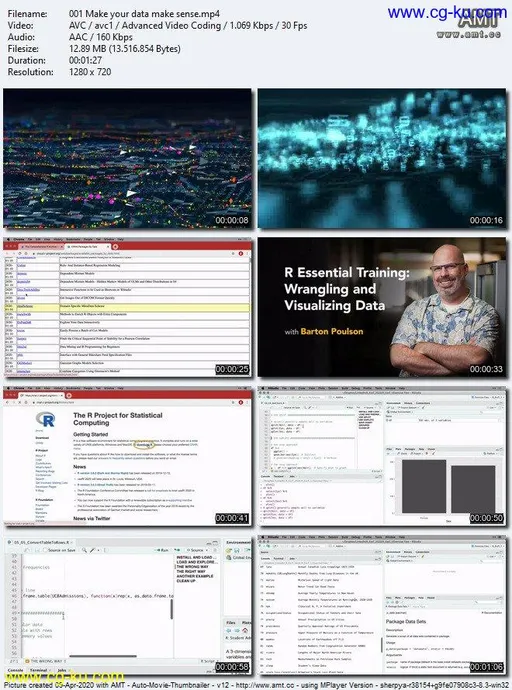
MP4 | Video: h264, 1280x720 | Audio: AAC, 44.1 KHz, 2 Ch
Skill Level: Intermediate | Genre: eLearning | Language: English + .srt | Duration: 45 Lectures (4h 18m) | Size: 654 MB
Trying to locate meaning and direction in big data is difficult. R can help you find your way. R is a statistical programming language to analyze and visualize the relationships between large amounts of data. This training series provides a thorough introduction to R, with detailed instruction for installing and navigating R and RStudio and hands-on examples, from exploratory graphics to neural networks. In part one, instructor Barton Poulson shows how to get R and popular R packages up and running and start importing, cleaning, and converting data for analysis. He also shows how to create visualizations such as bar charts, histograms, and scatterplots and transform categorical, qualitative, and outlier data to best meet your research questions and the requirements of your algorithms.
Topics includes:
Installing R
Entering data
Packages for R
Importing XLS, XML, and JSON data
Visualizing data with ggplot2
Creating charts, histograms, scatterplots, and graphs
Converting data
Filtering cases and subgroups
Recoding data
Creating scale scores


发布日期: 2020-04-10