MP4 | Video: h264, 1280x720 | Audio: AAC, 44.1 KHz, 2 Ch
Genre: eLearning | Language: English + .srt | Duration: 23 lectures (2 hour) | Size: 923 MB
Learn how to use Adobe after effects To Create infographics & data visualization
What you'll learn
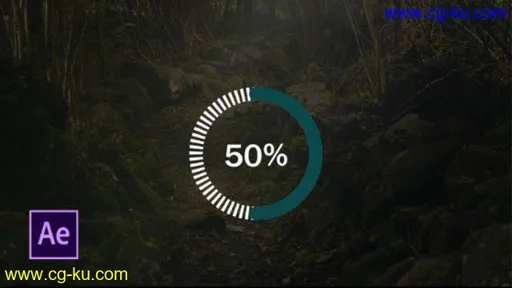
Create Animated infographics: line Graphs, Bar Charts and Pie Charts
Use special effects and presets to create graphs
Understand and Use expressions to help create charts
Apply pro techniques to change graph values
Requirements
Beginner's knowledge in After Effects
Adobe After Effects ver CS6 and beyond
want to improve your creative skills
Description
Hi there my name is Nshuti Paulin and i'am motion graphics designer welcome in this infographics & data visualization course the course that will teach you how to create infographics animation from scratch
This course is for beginners. You don’t need any previous knowledge in VFX Compositing or any motion graphics experience. We’ll start with the super basics, taking simple icons breathing life into to them with After Effects.
i will work you through all the steps to create infographics animation from animating icons with text animation , creating beautiful and gradient background, creating animated background, creating animated world map, where to find free music and sound for your project, where to download free icons and graphics for infographics
Know that I will be around to help - if you get lost you can drop a post on the video 'Questions and Answers' below each video and I'll be sure to get back to you.
What are you waiting for? Enroll Now!
Who this course is for:
After Effects users who want to develop their skills using expressions
anyone who work with data to present with infographics
Anyone that want to learn to create animated infographics
Motion Graphics Designers


发布日期: 2020-06-24