R Statistics Essential Training with Barton Poulson
MP4 + Exercise Files | Duration: 5h 59min | 960x540 | Video: 30 fps 1204 kbps | Audio: AAC 48 KHz 160 kbps 2 stereo | 1.05 GB
Genre: eLearning | Level: Intermediate | Language: English | Released: Sep 26, 2013
R is the language of big data—a statistical programming language that helps describe, mine, and test relationships between large amounts of data. Author Barton Poulson shows how to use R to model statistical relationships using graphs, calculations, tests, and other analysis tools. Learn how to enter and modify data; create charts, scatter plots, and histograms; examine outliers; calculate correlations; and compute regressions, bivariate associations, and statistics for three or more variables. Challenge exercises with step-by-step solutions allow you to test your skills as you progress.
Topics include:
• Installing R on your computer
• Using the built-in datasets
• Importing data
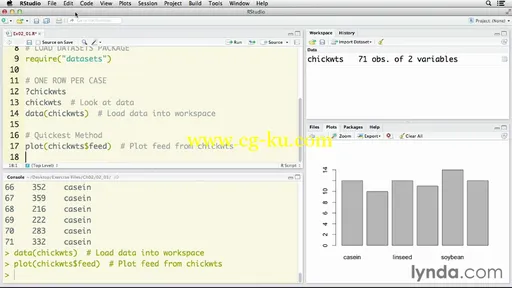
• Creating bar and pie charts for categorical variables
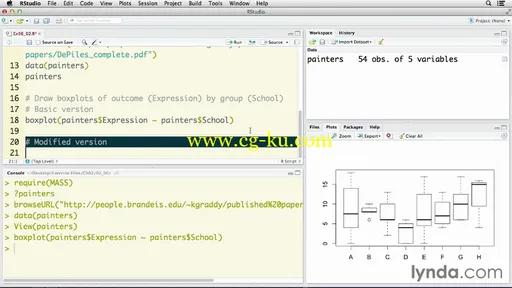
• Creating histograms and box plots for quantitative variables
• Calculating frequencies and descriptives
• Transforming variables
• Coding missing data
• Analyzing by subgroups
• Creating charts for associations
• Calculating correlations
• Creating charts and statistics for three or more variables
• Creating crosstabs for categorical variables


发布日期: 2014-04-01