CG数据库 >> Oreilly – From Scattered To Scatterplot In Less Than 2 Hours

Oreilly - From Scattered to Scatterplot in Less Than 2 Hours
English | .MP4 | AAC LC 2 channels 44.1 KHz | AVC
[email protected]
/* */
1280x720 pixels 25.000 fps @ 807 Kbps | 581.73MB
Genre: E-learning
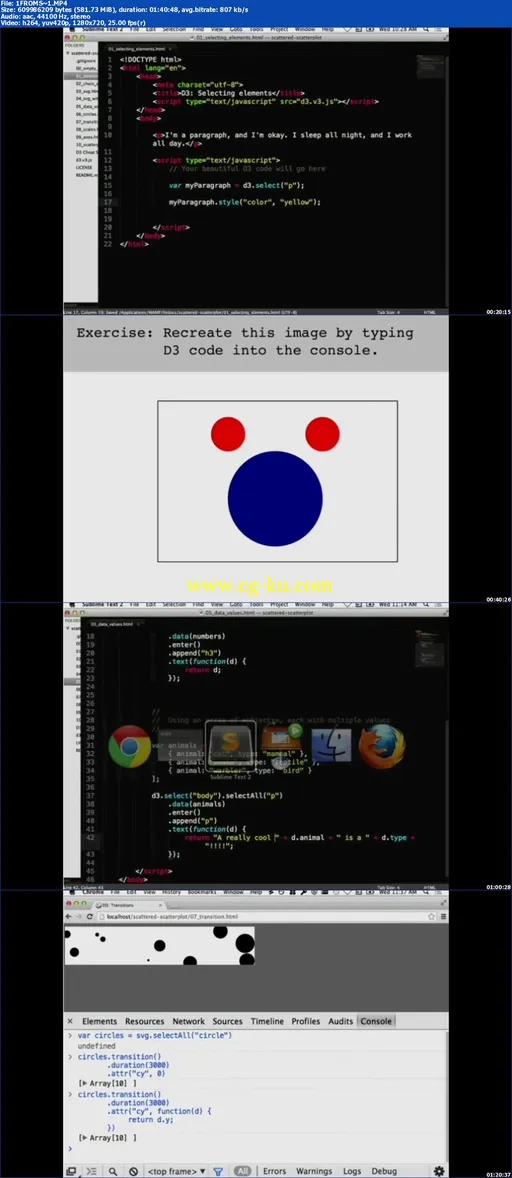
Confused by D3? Interested in coding data visualizations on the web but don't know where to start? This online tutorial will have you transforming data into visual images in no time at all starting from scratch and building an interactive scatterplot by the end of the session. We'll use d3.js the web's most powerful library for data visualization to load data and translate values into SVG elements - drawing lines points and scaled axes to label our data.

发布日期: 2014-05-19