Lynda - Up and Running with QlikView | 185MB
Duration: 1h 49m | Video: AVC (.mp4) 1280x720 15fps | Audio: AAC 48KHz 2ch
Genre: eLearning | Level: Beginner | Language: English
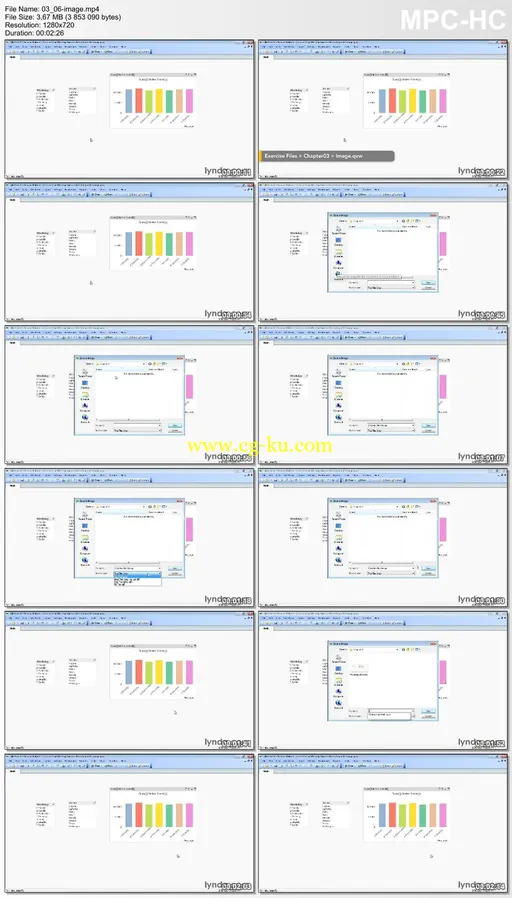
Up and Running with QlikView
shows how to analyze and display data using QlikView, the business intelligence and data visualization software that helps organizations make good decisions with their data. Author Curt Frye covers creating new visualizations from an existing data source, adding sheet objects and changing their properties, and printing and exporting sheet contents. After completing the course, viewers will be able to install QlikView 11, import and summarize data, create and manipulate data visualizations, and create pivot tables to display data in different ways—without multiple sheets.
Topics include:
* Installing QlikView
* Setting user preferences and document properties
* Creating visualizations
* Adding objects like List boxes, Multi boxes, and containers
* Adding, deleting, and moving sheets
* Sorting and filtering QlikView data
* Creating charts and pivot tables

发布日期: 2014-11-21