D3 and CoffeeScript: A Python Programmer's Introduction to Web Visualizations by Nikhil Gopal
English | Oct. 25, 2014 | ISBN: 978149190776 | mp4 | H264 1920x1080 | AAC 1 ch 125 kbps | 1 hr 49 min | 1.37 GB
eLearning | JavaScript
Create powerful data visualizations by learning how to use CoffeeScript and D3. With this fast-paced video course, you’ll leverage your knowledge of Python syntax to pick up the basics of CoffeeScript, the language that compiles to JavaScript. Then you’ll tackle the fundamentals of the D3 JavaScript library for implementing visualizations that are attractive, well designed, interactive, and updatable in real-time.
If you’ve been scared away by JavaScript in the past, or hit a frustrating roadblock in previous encounters with D3, download this video or stream it through our HD player, and learn how combining D3 with CoffeeScript will allow you to build some awesome data visualizations.
- Work step-by-step on three simple but compelling D3 visualization examples
- Use Coffeescript as a stepping-stone to ease your way into Javascript
- Reduce D3’s notoriously heavy learning curve by learning the basics
- Walk away with rudimentary understanding of CoffeeScript and D3 that you can apply to other projects immediately
- Use CoffeeScript to abstract away some of the more difficult aspects of Javascript
Nikhil Gopal has worked as a programmer, analyst, and scientist at major biotechnology companies such as Affymetrix and Illumina. He’s currently working on his PhD at the University of Washington in Seattle, specializing in novel algorithms and data visualization strategies in the realm of biomedical and health informatics.

Table of Contents
- Introduction to D3 and Coffeescript
00:02:40
- Environment
00:08:38
- Python vs Coffeescript
00:06:38
- D3 Core Concepts
00:12:25
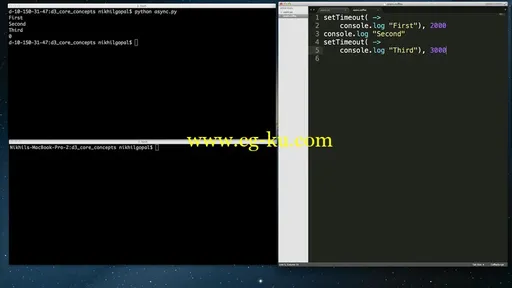
- Asynchronous
00:10:40
- SVG Coordinates
00:10:14
- Stock Chart
00:20:32
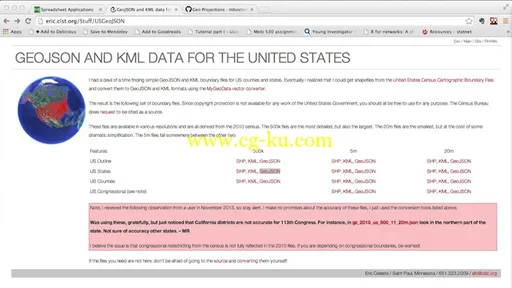
- Chloropleth
00:17:17
- Network
00:19:51

发布日期: 2014-12-03