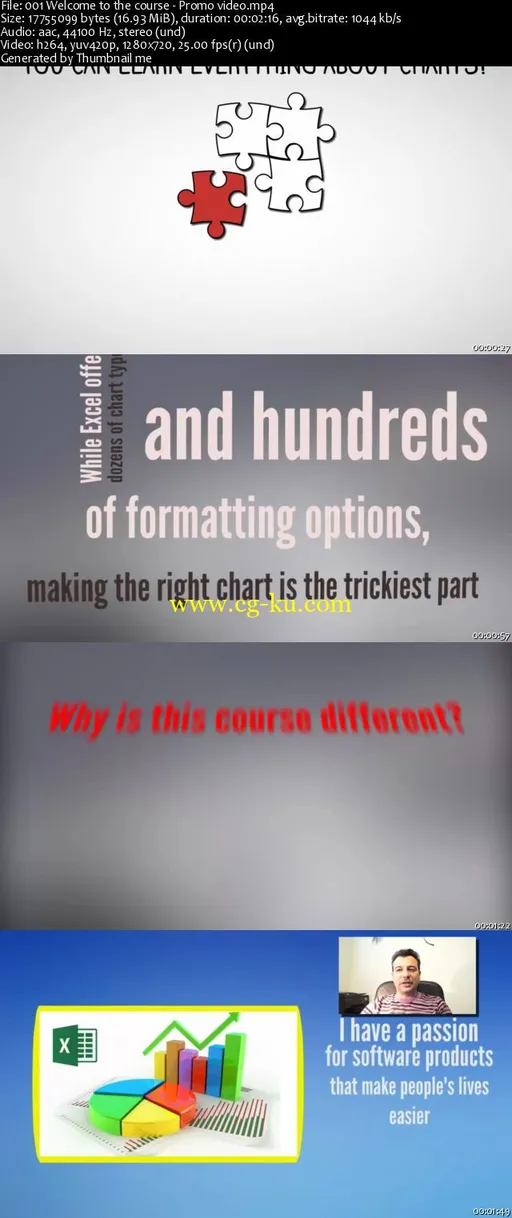
Master Excel Spreadsheet: Convert Data into powerful Charts
English | .MP4, AVC1, 1280x720 25fps | AAC, 2 Ch | 7+ hours | 1.1GB
Genre: eLearning
"Highly recommend! I have been very impressed by this course. The material is well organized and thorough. It covers the basics really well and does include some more advanced content. Thank you Andreas!" - Ioanna, Udemy Student
"The course is split in very small chunks makes it easy to find exactly the information that I am looking for. Andreas is an excellent instructor. This is a great course.Thank you for such a comprehensive and detailed course!" - Vanzel, Udemy Student
Do you:
struggle drawing charts in Excel?
want to learn how to make amazing Dynamic Excel Charts, Dashboards and Pivot Charts?
want to learn a skill that will help you get a job or make you stand out at your job?
In this course my goal is to give my students the practical knowledge, with real-world examples and step-by-step instructions, to create professional and designer-quality charts in Excel.
With over 70 Lectures, quizzes, assignments, real-life Excel projects and weekly updates, learning advanced Excel techniques has never been easier. This course is a concise and practical go-to guide for creating charts in Excel.
Why is this course different?
It’s super practical. Free downloadable Excel working files are included to allow you to follow along using the same material I use throughout the lectures. You can download all of them.
It’s comprehensive and fast. Excel charts are complex, that’s why the course is broken down into bite-sized pieces
Closed captions included
It has a quiz after section so to prove that you have learned the material.
You will learn the most current version of Microsoft Excel (2013) but the concepts are compatible with Excel 2010 and Excel 2007

发布日期: 2015-02-19