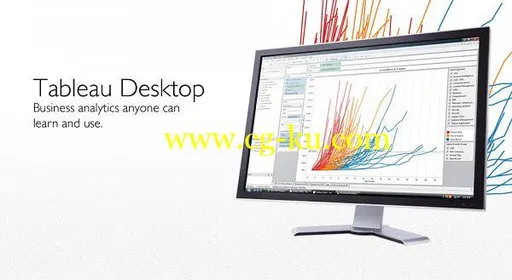
Tableau Desktop 是让您的工作保持流畅的数据分析工具。
它易于学习,便于使用,比现有的解决方案快出 10 到 100 倍。
Tableau Desktop 基于突破性的技术,能够将数据图片转化为数据库查询。
利用视觉观察图案的天赋能力,识别趋势,在数秒内发现可视化的真知灼见。
无需向导,无需脚本。
以风驰电掣的速度发现见解。
无需编写任何代码,就能连接到您的数据并执行查询。
利用拖放技术在视图之间切换时,实时保持流畅分析状态。
无论是存储在云中数 PB 的数据,还是数十亿行数据,Tableau 都能紧跟您的工作步伐。
它是人人都能使用的自助式分析。
无论是实时还是内存读取,均可在数秒内打开数据。
直接连接到您的数据,展开实时分析,发挥数据仓库潜力。
或者将您的数据提取到 Tableau 超快的数据引擎,充分发挥突破性内存内部架构的性能。
或者两者同时进行,不管是 2 个、3 个还是 10 个不同的数据源,都能将其混合起来。
这取决于您,依据您的数据情况而定。
利用美观的仪表板,分享您的见解。
利用数据推动决策。
将多个视图整合在交互式仪表板中。
突出显示和筛选数据,展现关系。
将具体见解串连成一个叙事线索,讲述您数据背后的原因所在。
使用基于 Web 的 Tableau Server 或 Tableau Online 共享内容。
创建以数据为导向的文化。
Tableau Desktop Pro 163.12 MBTableau Desktop Pro is a business intelligence tool that allows you to easily visualise, analyse and share large amounts of data.
Visual analysis in a click - Powerful analytical tools—at your fingertips.
Filter data dynamically, split trends across different categories or run an in-depth cohort analysis.
Double-click geographic fields to put data on a map.
All without writing a single line of code.
Deep statistics - Go deeper into your data with new calculations on existing data.
Make one-click forecasts, build box plots and see statistical summaries of your data.
Run trend analyses, regressions, correlations, and much more.
PhD not required.
Metadata management - Make better sense of your available data—quickly and easily.
Rename fields and modify number formats.
Combine fields into groups.
Create subsets of your data by simply selecting groups of points.
Use those sets to filter other views.
Build new hierarchies.
Now it’s easy for you to make your data understandable to everyone.
Best practices built in - You get the benefit of years of research on the best ways to represent data, built right into your workflow.
Optimized color schemes, automatic chart types and elegant design.
Communicate insight in the most effective way, automatically.
Data engine - When you want to take data offline or bring it in-memory, Tableau’s Data Engine lets you extract data for ad hoc analysis of massive data in seconds.
It combines advances in database and computer graphics technology to make even huge datasets possible to analyze on a laptop or mobile device.
VizQL technology - VizQL is a patented technology based on years of research at Stanford University.
It translates mouse clicks into database queries and displays the response graphically.
Data visualization becomes the process for discovering insights and sharing them with others.
OverviewAnswer questions as fast as you can think of them with DesktopTableau Desktop is data analysis that keeps you in the flow.
It’s easy to learn, easy to use, and 10-100x faster than existing solutions.
It’s built on breakthrough technology that translates pictures of data into optimized database queries.
Use your natural ability to see patterns, identify trends and discover visual insights in seconds.
No wizards, no scripts.
Discover insights at the speed of thoughtDiscover insights at the speed of thought Get to your data, live or in-memory, in secondsConnect directly to your data for live, up-to-date data analysis that taps into the power of your data warehouse.
Or extract data into Tableau’s blazing fast data engine and take advantage of breakthrough in-memory architecture.
Or do both, for 2, 3, or even 10 different data sources and blend them all together.
It’s up to you and your data.
See our list of native data connectors.
Share your insights with beautiful dashboardsDrive decisions using data.
Combine multiple views into interactive dashboards.
Highlight and filter data to show relationships.
String together specific insights into a guided story to explain the ‘why’ behind your data.
Share content using the web-based Tableau Server or Tableau Online.
Build a data-driven culture.
FeaturesVisual analysis in a clickPowerful analytical tools—at your fingertips.
Filter data dynamically, split trends across different categories or run an in-depth cohort analysis.
Double-click geographic fields to put data on an interactive map.
All without writing a single line of code.
Deep statisticsGo deeper into your data with new calculations on existing data.
Drag reference lines and forecasts, build box plots and see statistical summaries of your data.
Experiment with trend analyses, regressions, correlations, and much more.
PhD not required.
Metadata managementMake better sense of your available data—quickly and easily.
Rename fields and modify number formats.
Split your data into multiple fields or combine fields into groups.
Create subsets of your data by simply selecting groups of points.
Use those sets to filter other views.
Now it’s easy for you to make your data understandable to everyone.
Best practices built inYou get the benefit of years of research on the best ways to represent data, built right into your workflow.
Optimized color schemes, automatic chart types and elegant design.
Communicate insight in the most effective way, automatically.
Data engineWhen you want to take data offline or bring it in-memory, Tableau’s Data Engine lets you extract data for ad hoc analysis of massive data in seconds.
It combines advances in database and computer graphics technology to make even huge datasets possible to analyze on a laptop or mobile device.
MappingBeautiful, interactive maps are key to understanding place.
Double-click geographic fields to put data on a map.
Pan, zoom, filter or search to focus on your insights.
And with detailed map data worldwide, you can answer questions whether you are working with Australian postcodes or Brazilian municipalities.
Requirements- windows-Tableau.10.4.0.rar:Tableau.10.4.0.x64.rar:

发布日期: 2018-04-12