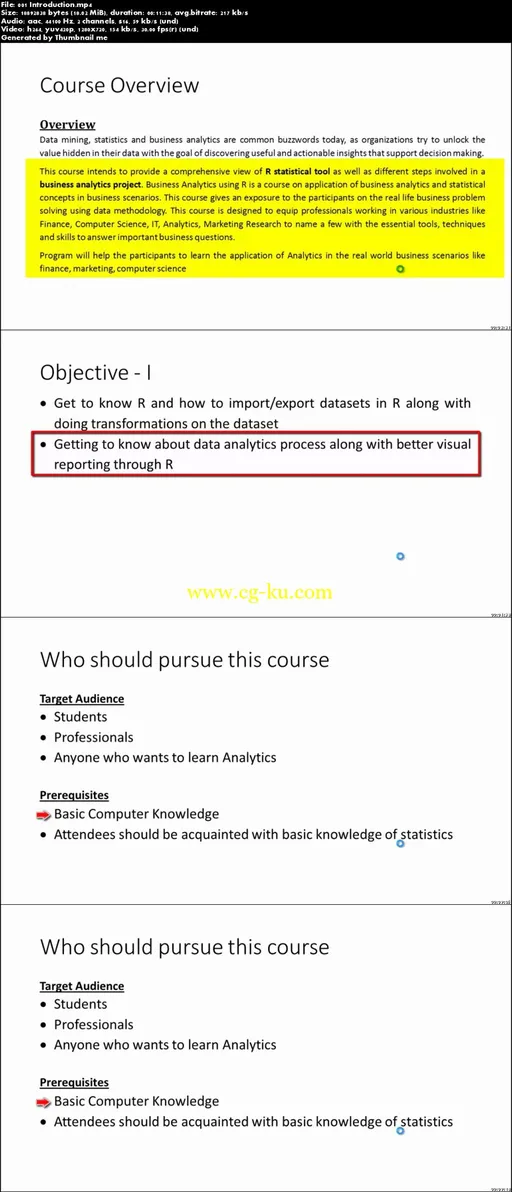
Udemy – R - Business Analytics Using R Programming
MP4 | Video: 1280x720 | 59 kbps | 44 KHz | Duration: 17 Hours | 2.68 GB
Genre: eLearning | Language: English
Use the R Programming to execute Business analytic, Data Science, Data Mining, Statistics Projects
This course ensure quick learning in a simplified way. It explains the most important aspects of working on data and conduct analysis through example. You will start by learning how to install and navigate R studio. Learn Data/Object Types and Operations, Importing into R, and Loops and Conditions. you will be introduced to the use of R in Analytics, where you will learn a little about each object type in R and use that in Data Mining/Analytical Operations. learn the use of R in Statistics, using R to evaluate Descriptive Statistics, Probability Distributions, Hypothesis Testing, Linear Modeling, Generalized Linear Models, Non-Linear Regression, and Trees. Learn to create 2-dimensional Univariate and Multi-variate plots. You will also learn about formatting various parts of a plot, covering a range of topics like Plot Layout, Region, Points, Lines, Axes, Text, Color and so on. If you want to learn R for use in data analytics, statistics and data science, you can count on this course to take you from beginner to an advanced level. Start off with the basics of R and dive deep into how to use R for statistics, vector arithmetic, generating regular sequences, logical filters, and more. Data is useless if you do not have the right tools to build informative graphs. Plots need to be understood easily while being accurate at the same time. R Programming for Business Analytic offers a variety of plotting devices, some of them are whole systems which need to be learned like a new language.

发布日期: 2015-07-28