Learning Python for Data Analysis and Visualization
MP4 | Video: 1280x720 | 76 kbps | 48 KHz | Duration: 20 Hours | 3.23 GB
Genre: eLearning | Language: English
Learn python and how to use it to analyze,visualize and present data. Includes tons of sample code and hours of video!
You'll get a full understanding of how to program with Python and how to use it in conjunction with scientific computing modules and libraries to analyze data.
You will also get lifetime access to over 90 example python code notebooks, new and updated videos, as well as future additions of various data analysis projects that you can use for a portfolio to show future employers!
By the end of this course you will:
- Have an understanding of how to program in Python.
- Know how to create and manipulate arrays using numpy and Python.
- Know how to use pandas to create and analyze data sets.
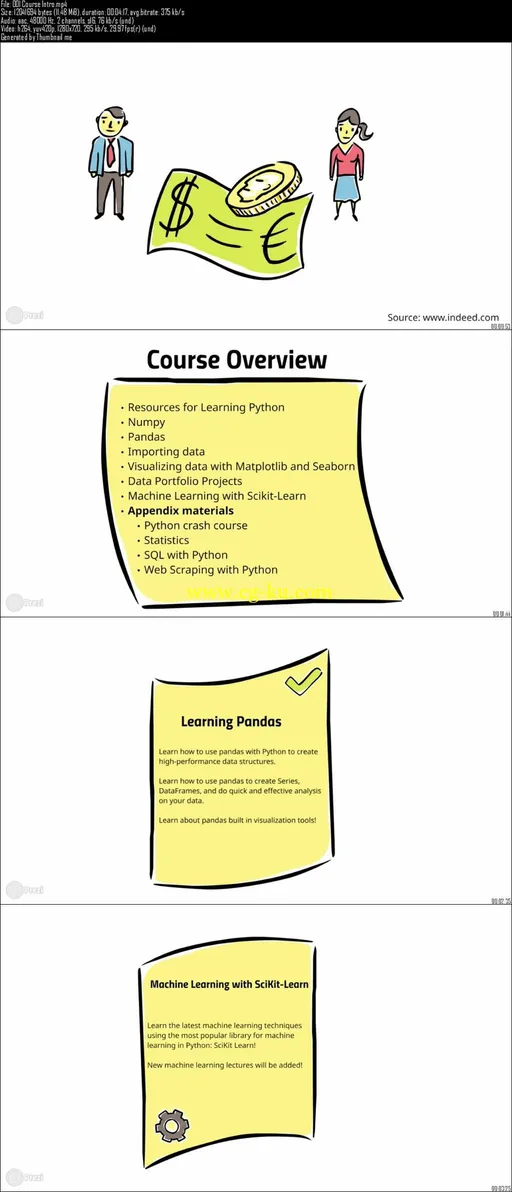
- Know how to use matplotlib and seaborn libraries to create beautiful data visualization.
- Have an amazing portfolio of example python data analysis projects!
- Have an understanding of Machine Learning and SciKit Learn!
With 90+ lectures and over 16 hours of information and more than 80 example python code notebooks, you will be excellently prepared for a future in data science!

发布日期: 2015-09-17