IBM SPSS Statistics: Getting Started
WEBRip | MP4/AVC, ~409 kb/s | 1462 x 720 | English: AAC, 59.8 kb/s (2 ch), 44.1 KHz | 536 MB
Genre: Business / Data & Analytics | Language: English | +Project Files
Learn how to enter, manipulate, analyze, and report data using IBM SPSS Statistics.
Description: IBM SPSS Statistics addresses the entire analytical process, from planning to data collection to analysis, to reporting and deployment. Analysts typically use SPSS Statistics to analyze data by testing hypotheses and then reporting the results.
Overview:
IBM SPSS Statistics: Getting Started is a series of self-paced videos (three hours of content). Students will learn the basics of using IBM SPSS Statistics for a typical data analysis session. Students will learn the fundamentals of reading data and assigning variable properties, data transformation, data analysis, and data presentation.
Topics that you will learn will include:
Know the Basics steps of Analysis
Read Data and Assigning Variable Properties.
Use the Data Editor: Tools and Exporting Data
Summarize Individual Variables
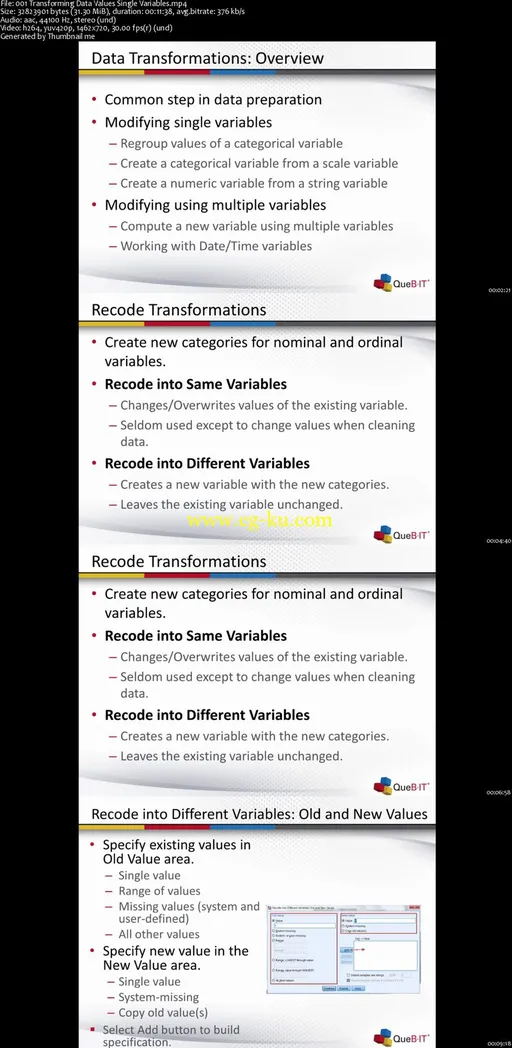
Transform Data Values: Single Variables
Transform Data: Computing Variables
Describe Relationships Between Variables
Use Viewer Output Tools and Export Output
This is a first course in using IBM SPSS Statistics. You can begin with this course even if you have never used SPSS Statistics before. The course will not delve deeply into statistical theory, but it will provide a compelling, clear, head start into the fundamentals of using the software, taught by experts users who having been using SPSS Statistics everyday for many years.
What are the requirements?
No statistical background is necessary
This course is for anyone that would like to learn how to use IBM SPSS Statistics
What am I going to get from this course?
Over 24 lectures and 3 hours of content!
Know the Basics steps of Analysis
Read Data and Assigning Variable Properties
Summarize Individual Variables
Transform Data Values: Single Variables
Transform Data: Computing Variables
Describe Relationships Between Variables
Use Viewer Output Tools and Export Output
What is the target audience?
This course is for anyone that would like to learn how to use IBM SPSS Statistics.
Curriculum
Section 1: An Introduction to IBM SPSS Statistics
Lecture 1 An Introduction to IBM SPSS Statistics 15:15
Lecture 2 Basic Analysis Demo 06:25
Section 2: Reading Data
Lecture 3 Reading Data 05:17
Lecture 4 Reading Data DemoExample 06:15
Section 3: Variable Properties
Lecture 5 Variable Properties 25:15
Lecture 6 Variable Properties Demo 05:01
Section 4: Summarizing Individual Variables
Lecture 7 Summarizing Individual Variables 21:21
Lecture 8 Summarizing Categorical Variables Demo 05:24
Lecture 9 Summarizing Scale Variables 02:24
Lecture 10 Summarizing Scales Variables Demo 02:52
Section 5: Transforming Data Values: Single Variables
Lecture 11 Transforming Data Values: Single Variables 11:38
Lecture 12 Transforming Data Values: Single Variables Demo 07:09
Section 6: Transforming Data: Computing Variables
Lecture 13 Transforming Data: Computing Variables 06:37
Lecture 14 Transforming Data: Computing Variables Demo 08:19
Section 7: Describing Relationships Between Variables
Lecture 15 Describing Relationships Between Variables 13:44
Lecture 16 Crosstabulations Demo 05:22
Lecture 17 Creating Charts 06:06
Lecture 18 Charts Demo 03:53
Section 8: Output Viewer Tools and Exporting Output
Lecture 19 Output Viewer Tools 02:45
Lecture 20 Output Viewer Tools Demo 02:58
Lecture 21 Copying and Pasting Output 05:59
Lecture 22 Copying and Pasting Output Demo 04:13
Lecture 23 Exporting Output 02:40
Lecture 24 Exporting Output Demo 04:34

发布日期: 2016-01-04