Animating Charts and Graphs in CINEMA 4D
2h 23m | Video: h264, yuv420p, 1280x720 | Audio: aac, 44100 Hz, 2 ch | 492 MB
Intermediate | Jan 09, 2016 | Genre: eLearning | Language: English
Charts and graphs have always been essential visual aids. With CINEMA 4D, you have all the tools you need to produce compelling animated versions of these static presentation tools. C4D's powerful primitive objects, spline tools, and node-based expression editor, XPresso, make it relatively easy to create dynamic animated charts and graphs.
This course is a project-based learning experience that will introduce different tools and techniques for importing, styling, and manipulating chart data in C4D. Alan Demafiles shows how to drive relationships between spreadsheet data and geometry with set-driven XPresso keys, connect points with tracer objects, and animate charts with dynamic primitive objects. He also explains how to customize the look and behavior of your charts and graphs to fit the style of your company or your client's.
Topics include:
*Using XPresso to link data
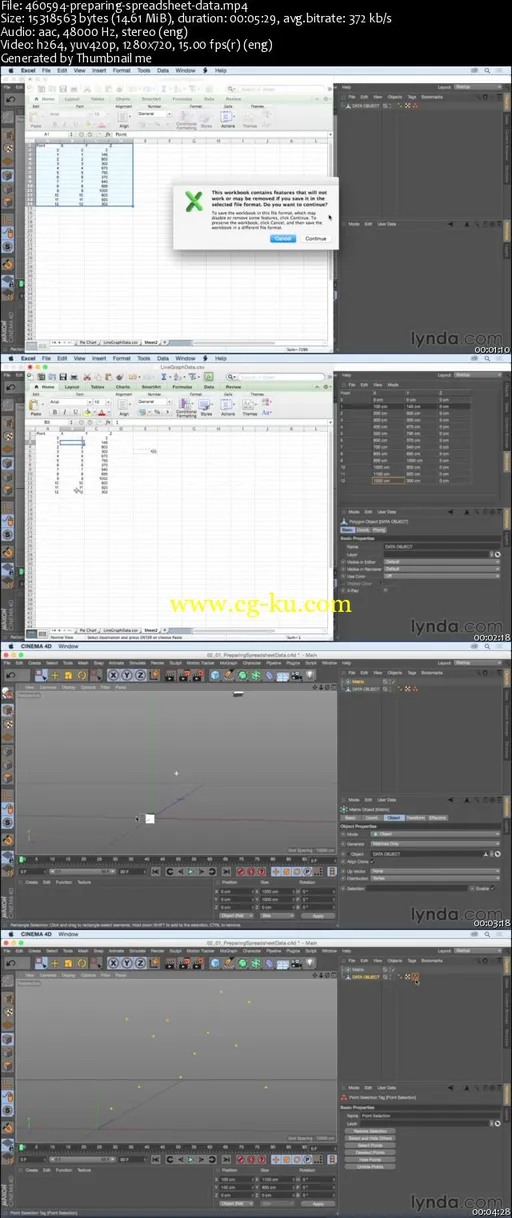
*Importing spreadsheet data into CINEMA 4D
*Harnessing mograph effectors
*Connecting dots with tracer objects
*Adding text and x- and y-axes
*Creating pie charts and bar charts with CINEMA 4D

发布日期: 2016-01-09