Excel Dashboards tips to impress your Manager
MP4 | Video: AVC 1280x720 | Audio: AAC 44KHz 2ch | Duration: 4.5 Hours | 1.02 GB
Genre: eLearning | Language: English
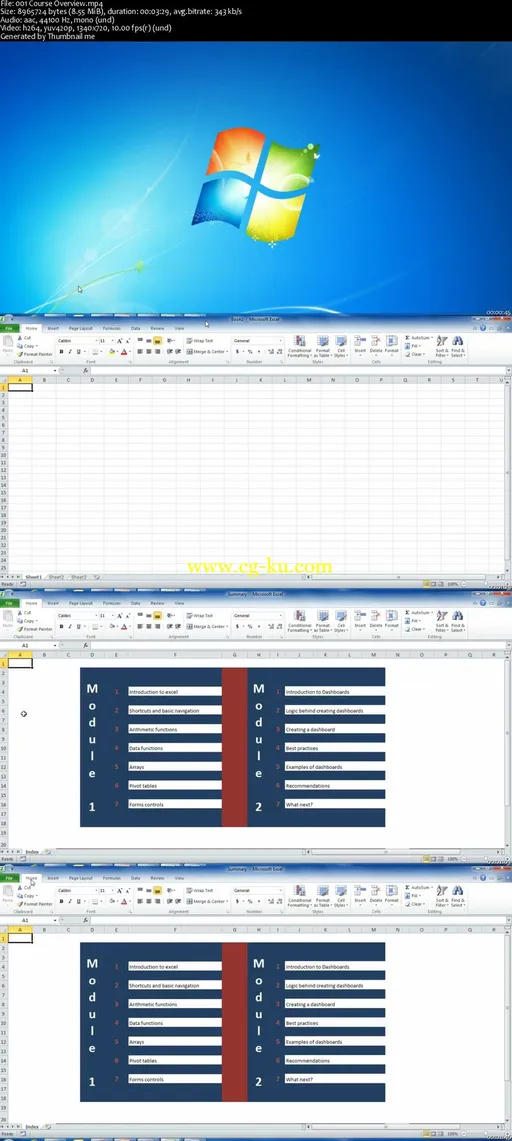
Learn Excel and best practices of creating Dashboard KPI's for Data Analysis.
An Excel Dashboard provides insight, analysis and alerts. They’re fully interactive and dynamic and can help with project management, customer service, retail management, financial forecasting and much more.
Key features:
Usually fits on one page
Displays key trends, comparisons and data graphically or in small tables
Provides the reader with conclusions to their objective
Is often interactive allowing the user to filter data and switch views themselves
Employs best practices that enable the report to be updated quickly and easily (often at the click of just one button)

发布日期: 2016-05-30