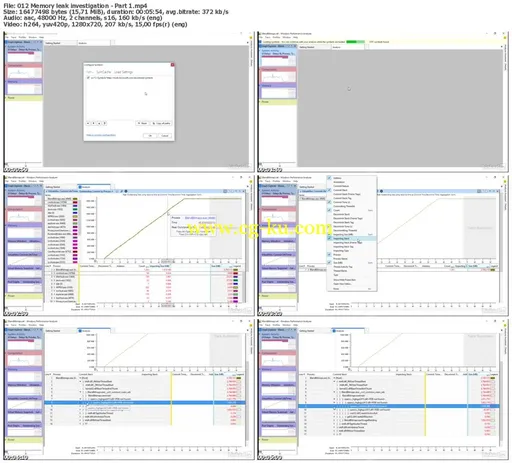
Lynda - Windows Performance Toolkit: Detecting Memory Leaks
Size: 2.13 GB | Duration: 0h 49m | Video: AVC (.mp4) 1280x720 15&30fps | Audio: AAC 48KHz 2ch
Genre: eLearning | Level: Intermediate | Language: English
Diagnosing application performance problems on a PC can feel like you have to be one part detective and one part psychic. Your application may compile and run fine—until boom, it crashes. These crashes are usually caused by memory leaks: poorly managed resource allocations in the application. Luckily, with Windows Performance Toolkit, you can locate and correct problems such as memory leaks quickly and efficiently. Thomas Pantels, former application engineer at Intel, shows how to analyze and optimize applications with memory leaks using Windows Performance Recorder (WPR) and Windows Performance Analyzer (WPA). He drills into an OpenCV application developed in C++, walks through the source code, and fixes the leak, providing a thorough overview of Windows Performance Toolkit in action and practical techniques that will help your applications make better use of system resources.
Topics include:
* Setting up the application
* Looking at the source code
* Gathering memory leak evidence
* Optimizing the application

发布日期: 2016-09-02