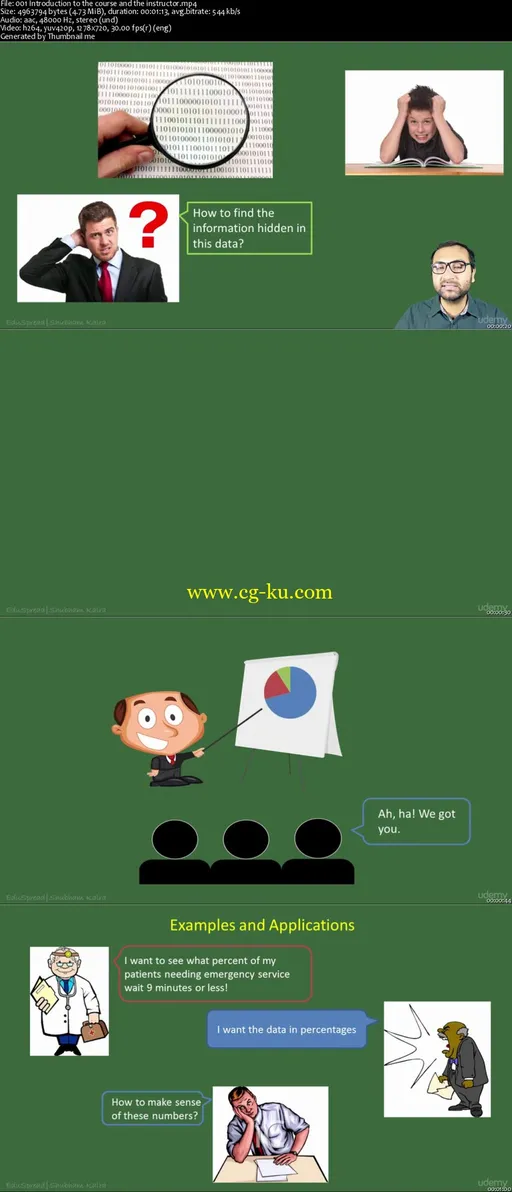
Data and Statistics (For Business and Economics)
MP4 | Video: AVC 1280x720 | Audio: AAC 44KHz 2ch | Duration: 3 Hours | Lec: 38 | 409 MB
Genre: eLearning | Language: English
Learn how to make sense of data using graphical presentations and numerical measures (Working in MS Excel included)
This course is designed for students and businesses who want to learn how to summarize data and communicate the results effectively.
In this course, I will take you through the tabular and graphical methods that one can use to turn data into information using Microsoft Excel.
There are no prerequisites required to take this course as I will start all the concepts from scratch.
How is this course structured?
First, I will take you through some basics of data - collection techniques and types. Then, I will discuss the tabular and graphical methods available to summarize the data (along with their working in excel) depending on what type of data we have.
After covering these methods, I will tell you some tips that you should use while deciding which chart type to choose for summarizing your data. (Not every chart or graph is suitable for all kinds of data)
Finally, we will end the course with some tips on how to get your audience's attention, how to make your data speak and some applications to solidify your learning.
Why should you take this course?
Because, its better to spend a couple of hours learning how to summarize and present your data than spending days to try and make sense of the data without knowing these methods.
All that said, lets get started..!

发布日期: 2016-10-06