Learning React.js Data Visualization
HDRips | MP4/AVC, ~413 kb/s | 1280x720 | Duration: 03:05:59 | English: AAC, 128 kb/s (2 ch) | 769 MB
Genre: Development / Programming
Make the most of your data using React.js.
-Familiarize yourself with different types of data such as XML and CSV that can be ingested by react apps
-Get empowered by visual elements such as maps, charts, and grids to make your data more impactful
-Master a variety of modern web technologies such as React, ES6, JSON, ChartJS, MongoDB, Express.js, and more
React is an incredibly popular part of modern full-stack web development, and is a keystone of fluid SPAs (single page applications). It is capable of rendering data reactively on to the web, enabling users to interact with it and see the results in real time.
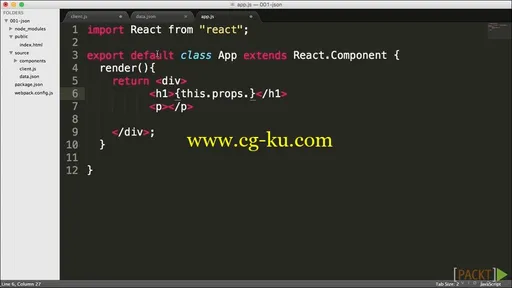
Using JSON as the data format, this course will show you how to ingest your data and display it on the web using a variety of techniques, such as charts and grids. It will run through the logic process, meaning that you will be able to take these skills and apply them in your own projects. Along the way, you will also learn more about the new ES6 language and how it can benefit your React skills, and how to create React controllers.
You’ll begin by gaining an understanding of JSON and how to create JSON files, then how to load them using webpack and ES6 and integrate them into a React component. We will then examine different data types, and you’ll find out how to move data between them in order to create a reactive map. Next, we’ll use ChartJS to display data in various chart forms, and finally we’ll look at how to load data dynamically from a MongoDB database and display it in our React component.

发布日期: 2016-11-18