Lynda - Creating Interactive Dashboards in Tableau 10
Size: 391 MB | Duration: 2h 24m | Video: AVC (.mp4) 1280x720 15&30fps | Audio: AAC 48KHz 2ch
Genre: eLearning | Level: Intermediate | Language: English
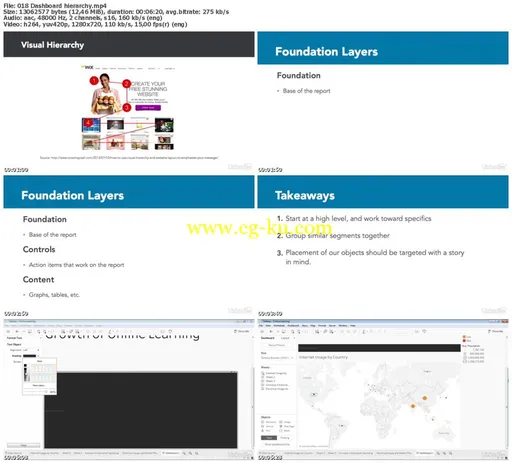
Explore your data in new ways with interactive dashboards in Tableau. Dashboards act like dynamic reports that can be used for in-depth data analysis or to present information to clients. In this course, Nate Makdad shows you how to create them in Tableau 10, the latest version of the software. He shows how to build and format the worksheets that will feed your dashboard, design the dashboard itself, integrate analytics, and add interactive parameters that allow users to customize the display. Along the way, you'll learn how to use some basic principles of visual design to make your dashboards easier to use and more visually appealing.
Topics include:
* Sketching your designs
* Formatting data
* Creating cross-data joins
* Creating visuals
* Grouping data
* Using stories vs. tabs
* Changing chart measures and types with interactive parameters
* Making iterations and improvements on your Tableau dashboard design

发布日期: 2016-12-03