Understanding SQL and R
HDRips | MP4/AVC, ~375 kb/s | 1280x720 | Duration: 06:11:06 | English: AAC, 128 kb/s (2 ch) | 1.53 GB
Genre: Development / Programming
This course is recommended for anyone (business analyst, researcher, social scientist, programmer, etc.) interested in analyzing and visualizing data. It shows you how to combine two of the most popular technologies used in data analytics: SQL and R. SQL is essential for communicating with relational databases, the type of database where most of the world's data is stored.
R is a statistical analysis tool: It uses SQL to interact with databases for the purpose of creating charts, plots, reports, visualizations, and even web applications that incorporate data into a final product. Complete this course and you'll learn the basics of a skill set highly valued by employers around the globe. The course will go fastest for those with basic command line interface experience and some previous exposure to both SQL and R.
Gain experience combining SQL and R for data analytics and visualization purposes
Learn to write SQL queries that can retrieve and summarize data stored in databases
Explore the statistical analysis and visualization capabilities of R
See how R uses SQL to interact with databases
Discover how to create graphics using R, based on data in databases
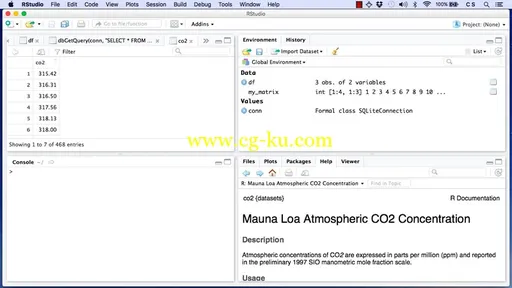
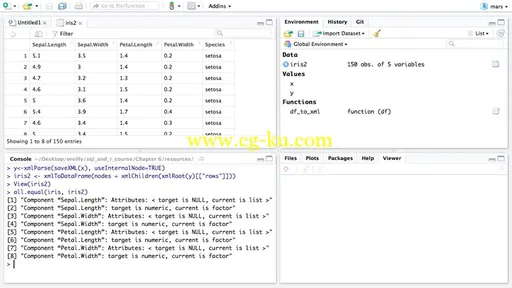
Learn to use features of RStudio to streamline the analysis process


发布日期: 2016-12-05