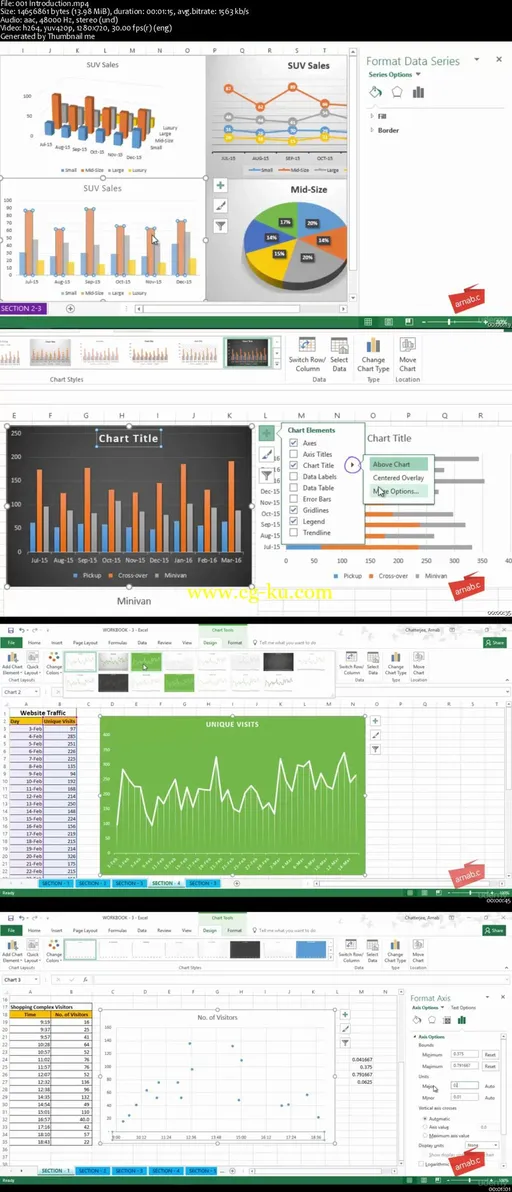
Microsoft Excel 2016: Advanced Training in Charts
MP4 | Video: AVC 1280x720 | Audio: AAC 44KHz 2ch | Duration: 2 Hours | Lec: 45 | 401 MB
Genre: eLearning | Language: English
Become a pro with charts in Excel 2016. Lessons on advanced customization, standard, specialized, and new chart types.
This course will show you how to create advanced charts quickly and accurately. Create smart charts that effortlessly articulate the meaning behind the data to your audience and make your charts stand out.
Charts in Excel are one of the most widely used solutions for analyzing and visualizing data. Excel 2016 comes with improved visualizations and six new types of charts. In addition to the new advanced chart types, learn how to create different kinds of Excel charts, from column, doughnut, and line charts to gantt, and decide which type works best for your data. The course includes lessons on all advanced customization features, standard, specialized, and new chart types.
Rich customization options in Excel 2016 can help you create some of the most popular data visualizations for financial or hierarchal information or for revealing statistical properties in the data.
The course focuses on practical examples that will help you easily transition to using Excel 2016 charts in a dynamic way in real-world scenarios.

发布日期: 2017-01-11