Stock Technical Analysis with Excel
MP4 | Video: 1280x720 | 55 kbps | 48 KHz | Duration: 7 Hours | 1.51 GB
Genre: eLearning | Language: English
Learn stock fundamental analysis main concepts from basic to expert level through a practical course with Excel.
Learn stock fundamental analysis through a practical course with Excel and real world examples. It explores main concepts from basic to expert level which will help you achieve better grades, review concepts and polish skills for your new finance career or make decisions as DIY investor. All of this while referencing best practitioners and Nobel Prize winners.
Become a Stock Fundamental Analysis Expert in this Practical Course with Excel
Understand main financial statements.
Interpret financial and investment ratios.
Define a company's cost of equity, debt and capital.
Valuate a company's theoretical stock price.
Calculate a company's stock option prices.
Explore the wisdom of best practitioners and Nobel Prize winners.
Become a Stock Fundamental Analysis Expert and Put Your Knowledge in Practice
readmore
Learning stock fundamental analysis is essential for finance careers in areas such as equity research, investment banking, private equity or venture capital. It is also indispensable for academic careers in finance or business research. And it is one of the two most common analysis techniques for DIY investors.
But as learning process can become difficult as complexity grows, this course helps by leading you through step by step real world practical examples for greater effectiveness.
Content and Overview
This practical course contains over 42 lectures and more than 6 hours of content. It's designed for all stock financial analysis knowledge levels and a basic understanding of Excel is recommended.
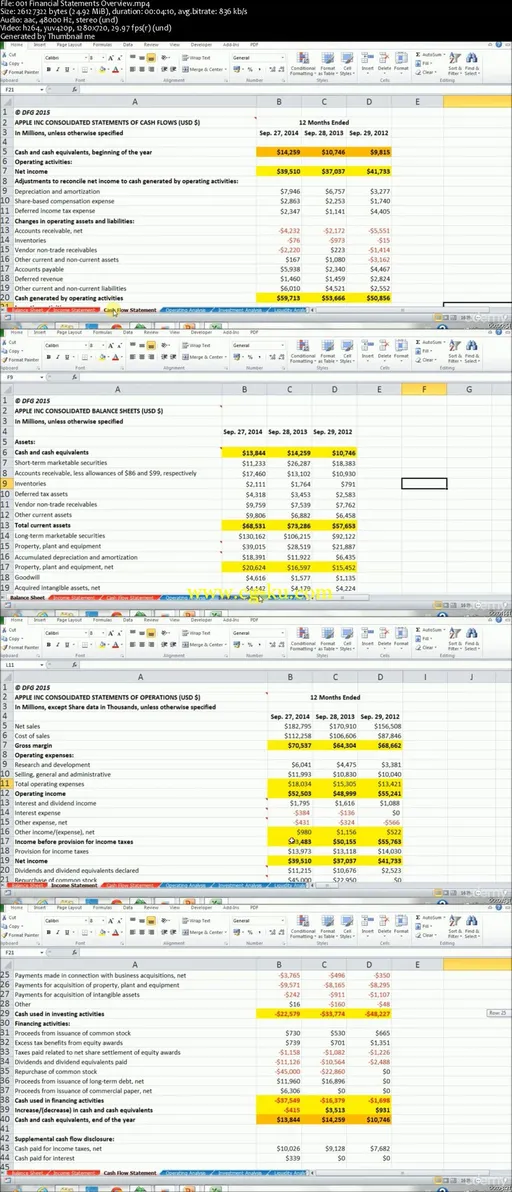
At first, you'll understand main financial statements which are the balance sheet, income statement and cash flow statement. With these you'll calculate financial ratios to analyze a company's operations, investments, liquidity, solvency and profitability. Then, you'll estimate investment ratios with stock market data such as P/E and dividends yield for valuation purposes.
After that, you'll calculate a company's cost of equity, debt and capital with CAPM, Fama-French factors, APT and WACC models. With these you´ll estimate a company's stock theoretical value through EVA, DCF models and do a valuation by comparing it to its market price.
Finally, you'll calculate a stock's financial option prices with Black & Scholes, Binomial models and Monte Carlo Simulation method.

发布日期: 2017-03-20