GEPlot 2.1.31.0 | 3.0 MB
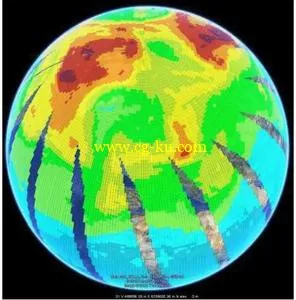
GEPlot is a Windows application for plotting contour lines and grids in Google Earth. With GEPlot you can plot your geographical data both over a small domain and over the whole world. GEPlot produces KML and KMZ files that can be loaded in Google Earth. The input can be ASCII (X,Y,Z format or Golden Software Surfer GRD format) files or Microsoft Excel files organised as X,Y,Z columns. GEPlot allows to produce grid and contour plots for any georeferenced variable, such as, for example, orography, land use, air pollution levels, noise levels, population data, etc.
Some features:
Loads data on regular grids from ASCII files (CSV, DAT, …)
Loads data on regular grids from ASCII GRD files (Golden Software Surfer format)
Loads data on regular grids from Microsoft Excel files (XLS and XLSX)
Loads AERMOD output files (PLOT files) and create KML concentration contour files directly from them.
Batch processing: automatically create KML files from all the input files in a specific folder
Manages UTM coordinates (both m and km), metric non-UTM coordinates (or UTM traslated), and geographical coordinates (longitude and latitude)
Allows to select colours, width and height of contours
Allows to select colours, width, height and opacity of grids
Allows to save and load frequently used levels
Allows to save and load plot configuration
Allows to create plot legends
Calculates statistics (average, percentiles, etc.) of the input data
Home Page
-
https://www.enviroware.com
发布日期: 2017-08-21