Getting Started with Data Analysis Using Python
MP4 | Video: AVC 1280x720 | Audio: AAC 44KHz 2ch | Duration: 2.5 Hours | 424 MB
Genre: eLearning | Language: English
Python is an excellent tool for data analysis. In this course, you'll learn how to collect, analyze, and persist data, then build data visualizations using python, csv files, sqlite, and pygal.
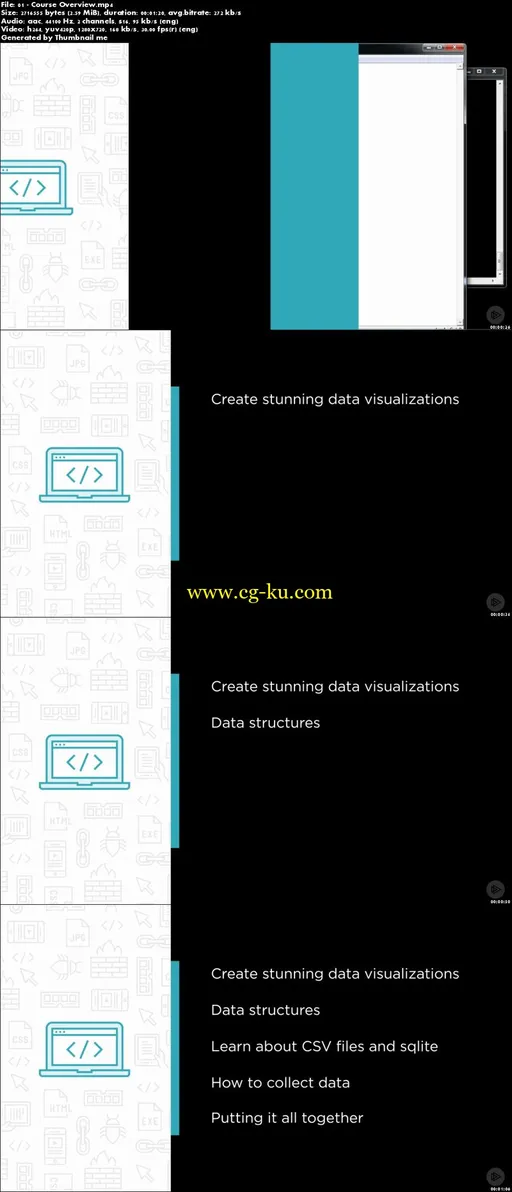
Data analysis is one of the fastest growing fields, and Python is one of the best tools to solve these problems. In this course, Getting Started with Data Analysis Using Python, you'll learn how to use Python to collect, clean, analyze, and persist data. First, you'll discover techniques including persisting data with csv files, pickle files, and databases, along with the ins and outs of basic SQL and Sqlite command line. Next, you'll delve into data analysis and how to use common data structures, such as lists, dictionaries, tuples, and sets. Additionally, you'll learn how to use these structures and apply these skills to widely available stock market data. Finally, you'll explore pygal, a Python library for data visualization. When you're finished with this course, you'll have the necessary knowledge to efficiently build stunning charts and graphs utilizing data analysis in Python.

发布日期: 2017-09-15