Graphs in R - Data Visualization with R Programming LanguageMP4 | Video: AVC 1280x720 | Audio: AAC 44KHz 2ch | Duration: 5 Hours | Lec: 46 | 727 MBGenre: eLearning | Language: EnglishConvincing R graphs using ggplot 2, lattice, plotrix & base. Use the powerful R language to create vivid visualizationsR-Tutorials shows how to create convincing graphs in RDo you want to create overwhelming plots?Do you want to show your data crystal clear?Do you want your data to be understood by everyone?Do you want a versatile graphics toolbox?Do you want powerful formatting skills?If you anwered YES to some of these questions - this course is for you!Data is useless if you do not have the right tools to build informative graphs.
Plots need to be understood easily while being accurate at the same time.
R-Tutorials gladly enlarges your data toolbox so that you can surmount in your career.
R offers a variety of plotting devices, some of them (like ggplot2) are whole systems which need to be learned like a new language.
R-Tutorials shows how to learn those languages.
In this course you will learn about the most important plotting packages ggplot2, lattice and plotrix.
According to the teaching principles of R Tutorials every section is enforced by exercises for a better learning experience.
You can download the code pdf of every section to try the presented code on your own.
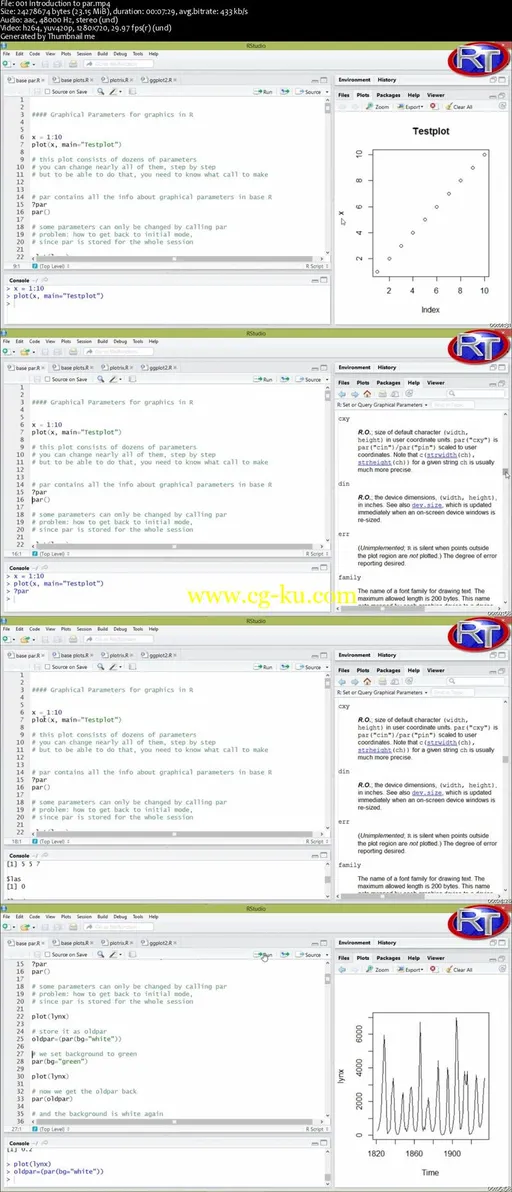
The course starts with the base parameters which are needed to format and manipulate any basic graphs in R.
After that you will learn about the most common types of graphs in R base and you will see some very useful graphical extensions of the plotrix package.
Ggplot2 is a very famous graphs package and is viewed as the most powerful graphics device R has to offer.
You will get an in depth tutorial on that package.
At last you can see how Lattice offers some more very useful functions.
With that knowledge you will have an extremely powerful toolbox to excel in your career and in your studies.
发布日期: 2017-11-14