Data Science with R Master ClassMP4 | Video: AVC 1280x720 | Audio: AAC 44KHz 2ch | Duration: 4 Hours | 1.94 GBGenre: eLearning | Language: EnglishThis video series will show you how to apply R to your data science projects.
You will learn to perform the data science process including data acquisition, data transformation, exploratory data analysis, data visualization, and statistical learning algorithm usage.
This course will provide you with the tools and techniques required to excel with statistical learning methods in tackling important data problem domains.
The R statistical environment was chosen for use in this course because many data scientists use it exclusively for their project work.
All of the code examples for the course are written in R.
In addition, many popular R packages and data sets will be used.
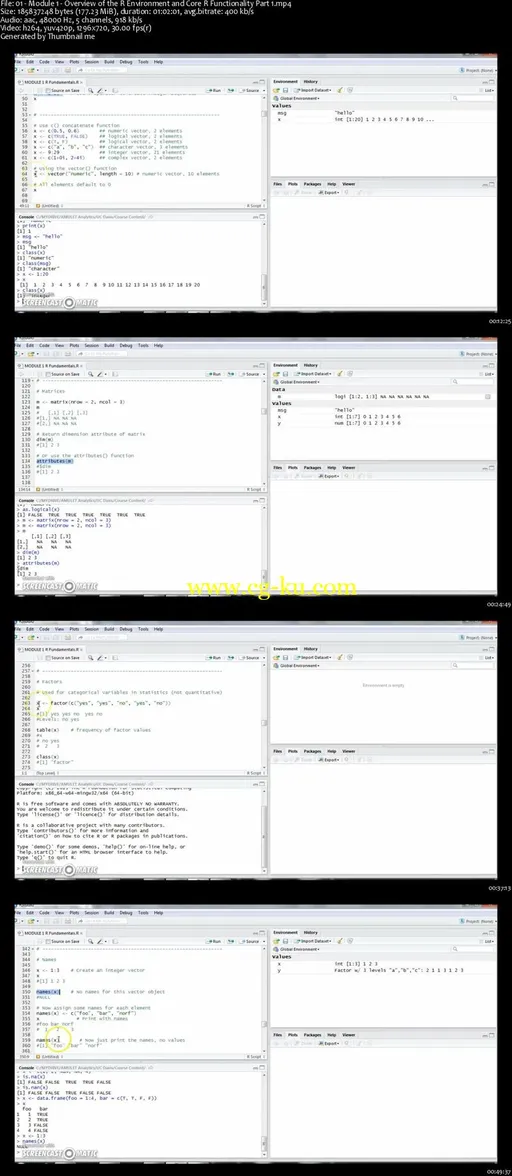
Course Objectives:Employ use of “the data science process”Demonstrate how to succinctly state goals for a data science projectLearn basic constructs of the R programming languageDemonstrate the data acquisition processEmploy basic data transformation techniquesPerform exploratory data analysisUse R the programming language to demonstrate an understanding of supervised and unsupervised learning algorithms in the context of a given business problemThere are 10 modules, each with a series of screencasts demonstrating techniques in data science:Module 1: Overview of the R Environment and Core R Functionality Part 1.
This clip covers how to set up R and how to apply R vectors, matrices, lists, factors, data frames, and arrays.
Understand coercion, and how to detect missing values.
Module 2: Core R Functionality Part 2.
This clip covers how to subset vectors, matrices, and lists.
Learn about the subset function and how to detect NAs and remove NULLs.
Module 3: Core R Functionality Part 3.
This clip covers more advanced R functionality including vectorized operations, matrix transpose inverse, lapply, and sapply.
Learn about conditionals (if-then statements) and loops, as well as user-defined functionality.
Module 4: Core R Functionality Part 4.
This clip concludes the core R functionality with an assortment of useful functions including apply, tapply, split, and mapply.
Learn about random variables and ways of managing date and time.
Module 5: Accessing Data Sets.
This clip covers how to load structured and unstructured sources into R, including data from CSV, Excel, JSON, SQL databases, and web pages.
Module 6: Data Transformation.
This clip covers how to transform a raw data set into a form ready for exploratory data analysis, and apply functions such as lubridate, merge, sort, reshape, and dplyr.
Learn about feature scaling.
Module 7: Exploratory Data Analysis.
This clip explains how to perform exploratory data analysis in R and leverage some R statistical functions and the common statistical tests that are available in R.
Module 8: Data Visualization.
This clip covers how to do data visualization in R, including using R to create histograms, box plots, bar plots, density plots, scatter plots, QQ plots, heatmaps, NA plots, and expository plots.
Module 9: Supervised Statistical Learning.
This clip covers how to do supervised learning in R, including simple and multiple linear regression, residual plots, and diagnostic plots.
Learn how to make predictions using trained models.
Module 10: Unsupervised Statistical Learning.
This clip covers how to do unsupervised learning in R to discover patterns in the data, including various clustering techniques, such as hierarchical clustering, kmeans clustering, and heatmaps.
发布日期: 2017-12-08