Wingware WingIDE 是一个基于Python编程语言开发的集成开发环境。
为软件开发者提供了一个集成的工程管理器、图形界面的调试器、源代码浏览器,并预设了一个高级的源代码编辑器。
事实证明,和C、C++、Java以及其它编程语言相比,Python将大大提高程序员的开发效率。
Wing IDE将充分地利用Python简单、功能强大以及可升级性等独特的优势。
据Archaeopteryx软件公司透露,他们的开发人员一直在使用Wing IDE,大大提高了程序员们的工作效率。
Wingware Wing IDE Professional 6.0.8.2 Multilingual MacOSX | 71.77 MBWing IDE Professional is a full-featured Python IDE designed for professional programmers.
It includes powerful editor, code intelligence, refactoring, debugging, search, unit testing, project management, and revision control features.
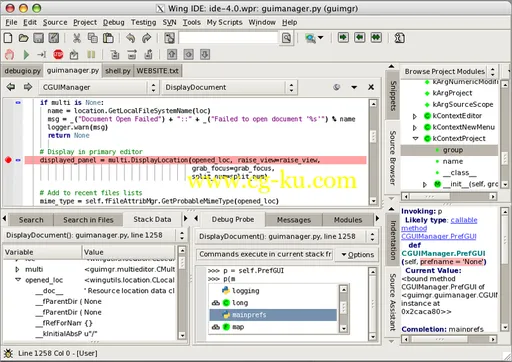
The Wing IDE layout is straightforward, with the editor window being its central fixture.
Supporting panes, source browser, runtime output and debug panes and so on, are arranged on the periphery.
In the lower right is the eminently useful Source Assistant pane, the Wing IDE's answer to call tips.
Begin typing, say, a function call, and the prototype and docstrings information for the corresponding functions are displayed in the Source Assistant.
Continue typing, and the likely matches are appropriately reduced.
Also, when you click a function name anywhere in the editor (whether at a definition point or a reference point), the function's information is displayed in the Source Assistant.
If you select a method, and that method has overridden a parent class method, the Source Assistant displays a clickable link for the location of the overridden method.
Wingware's debugger is highly configurable.
For example, you can set the debugger to stop when an exception is raised, but before the except or finally clauses have run; or you can configure the debugger to let those clauses run and then halt execution.
Also, you can configure the debugger's watch system to display an object's content only when that object is in context, or hold a reference to the object and show its contents regardless of the current context.
The debugger can handle multithreaded applications, when debugging the target application is halted by, say, a breakpoint, by default the debugger stops all threads and indicates which thread caused the suspension.
However, this is configurable so that, if one thread hits a breakpoint, the others can continue to run.
Features:GUI, Web, and script debuggingException traceback reportingView stack, locals/globals, and return valueSupports input() and raw_input()Integrated debug process I/O with configurable text encodingNative console I/OMulti-threaded debuggingRemote debuggingDebug value tooltipsDetect unhandled exceptionsWorks with Django, web2py, Flask, Google App Engine, Plone, Turbogears, Zope and PloneAlter debug data valuesMultiple named entry points and debug launch configurationsInteractive debug probe with auto-completion, syntax highlighting, goto-definition, call tips, and documentation linksConvenient Restart Debugging toolTrack values by referenceEvaluate expressionsConditional breakpointsIgnore-counted breakpointsEnable/disable breakpointsMove debug program counterMulti-process and automatic child process debuggingDebugs unit testsBreakpoint managerProcess attach/detachInspect sys.modulesDebug Django template filesmatplotlib mainloop supportMark a range of code in the editor for quick reevaluation in Python Shell or Debug Probe
发布日期: 2017-12-11