Visualizing Data with Amazon QuickSight
MP4 | Video: AVC 1280x720 | Audio: AAC 44KHz 2ch | Duration: 3 Hours | 384 MB
Genre: eLearning | Language: English
Amazon QuickSight is a new, cloud-based business analytics service enabling users to visualize and extract business insight from their data. This course teaches you how to connect, prepare and analyze your data inside one of Amazon's newest services.
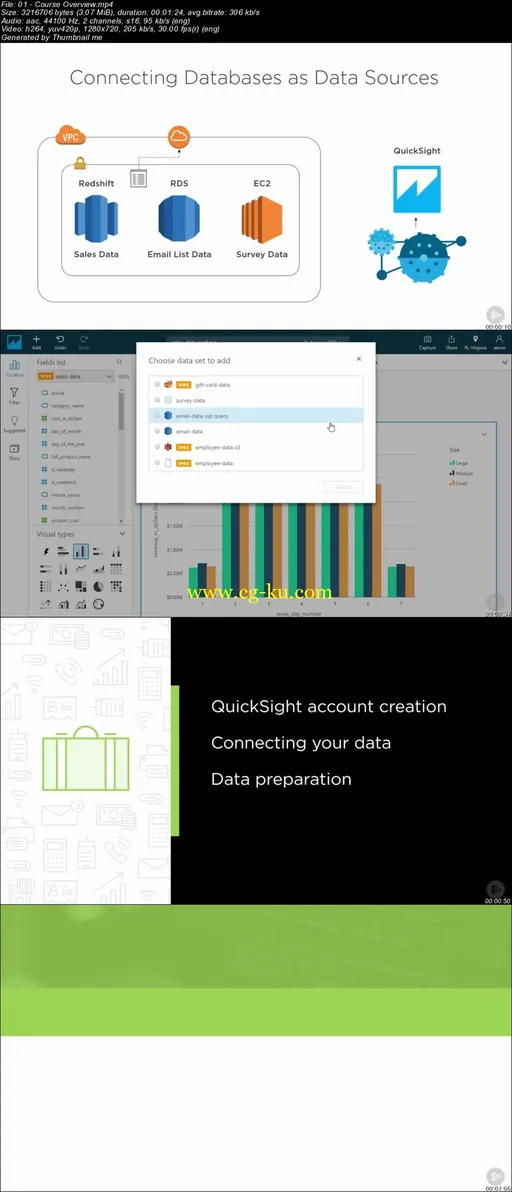
Using data and analytics to drive decision-making ensures organizations stay competitive and efficient. In this course, Visualizing Data with Amazon QuickSight, you'll begin by learning how to create and manage a QuickSight account. From there, you'll explore the steps required to connect your data sources, both on-premises and cloud-based, to the QuickSight service. Next, you'll discover how to prepare data sets within the QuickSight interface using items like filters and calculated fields. Finally, you'll master how to analyze data sets using the features and visualizations provided by one of the newest offerings of Amazon Web Services. By the end of this course, you'll evolve from someone who has never seen QuickSight to a pro capable of analyzing your own data to drive and inform critical decision-making.


发布日期: 2018-01-22