Data Analysis and Dashboards with Google Data Studio
MP4 | Video: AVC 1280x720 | Audio: AAC 44KHz 2ch | Duration: 3 Hours | 583 MB
Genre: eLearning | Language: English
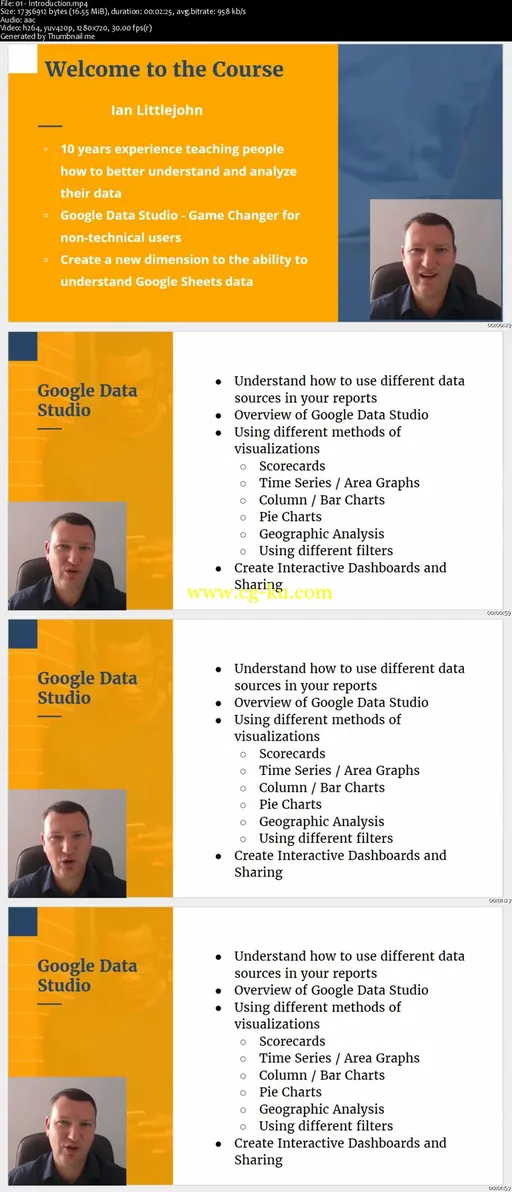
In this course we are going to show you how to supercharge your Google Sheets into Interactive Dashboards and incredible reports. Google Data Studio works seamlessly with your Google Sheets data to create amazing data analysis in minutes. Google Data Studio is an incredibly easy to use drag and drop tool that allows a multitude of different visualizations to be created in minutes. The addition of filtering tools produces stunning reports that will take your data analysis to the next level. Google Data Studio is available for free to people with a Google or Gmail account. In addition reports and dashboards can be shared to any users whether they have a Google account or not. In this course we are going to teach you the following: How to connect Data Studio to Google Sheets Learn how to calculate Averages, Highest values, Lowest Values and number of Unique Values Create Scorecards to display key metrics and KPIs Create powerful trend analysis graphs to help with forecasting Create Year to Date, Month to Date and Previous Month calculations with the click of a mouse button Learn to gain powerful analysis from Stacked Bar and 100% graphs Create powerful Time and Category filters to easily create interactive reports Learn to share your Reports and Dashboards with other users Google Data Studio is truly an amazing product for creating insight and intelligence from your Google Sheets data.You will need a Google Account,Google Sheets and Google Data Studio.


发布日期: 2018-02-05