Data Modelling and Analysis with Excel Power Pivot
MP4 | Video: AVC 1280x720 | Audio: AAC 44KHz 2ch | Duration: 2 Hours | 917 MB
Genre: eLearning | Language: English
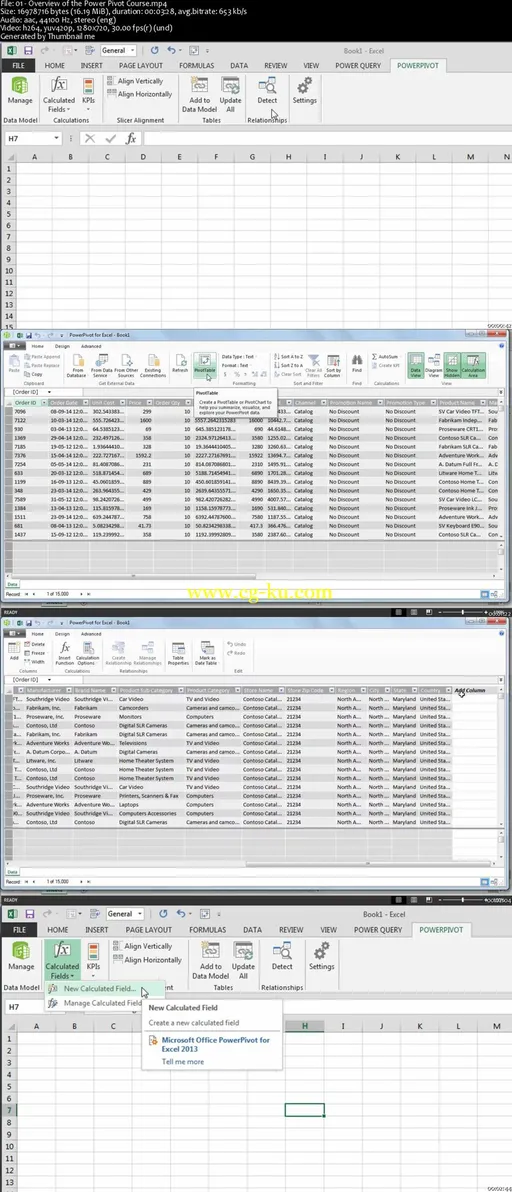
Power Pivot has been described as the most important new feature in Excel in 20 years. Power Pivot has been developed by Microsoft to help companies analyze and understand the growing quantities of data that are created on a daily basis. Power Pivot will improve your time to create reports, develop data analysis and gain insight into your your data by at least 80%. Create relationships between tables of data without Vlookups Create powerful Key Metric and Key Performance Indicator calculations Manage and work with data models of millions of records of data Create powerful new dashboards and reports Power Pivot is a free Add-in for Excel 2010 and is called the Data Model in Excel 2013 that provides capabilities to handle large quantities of data. PowerPivot is a columnar database that is capable of storing and manipulating hundreds of millions rows of data. PowerPivot brings new capabilities to business users to analyse, explore and gain new insight into business and marketing data. PowerPivot has been referred to as the most important feature for Excel in 20 years. Power Pivot makes it easy to setup relationships between tables of data in the same way as databases and therefore does not require the use of Excel functions such as Vlookup. PowerPivot therefore decreases the time substantially to analyse and gain new insight from business and marketing data. Power Pivot allows the rapid development of powerful PivotTables and PivotCharts in Excel utilising the latest Slicer technology to easily analyse and view data from multiple different perspectives. PowerPivot also adds a new Data Analysis Expressions (DAX) formula language that provides new and powerful calculations and insight to the business user.


发布日期: 2018-02-07