Debugging and Monitoring TensorFlow Programs
MP4 | Video: AVC 1280x720 | Audio: AAC 44KHz 2ch | Duration: 2 Hours 17M | 339 MB
Genre: eLearning | Language: English
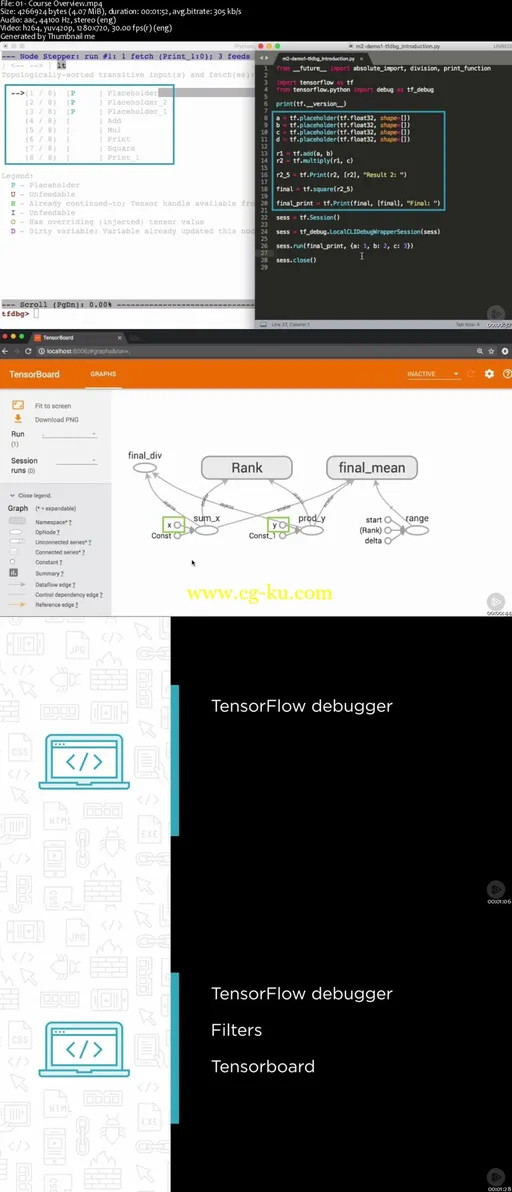
This course goes deep into two specific tools in the TensorFlow toolkit - tfdbg and TensorBoard. These tools can be used to examine the internal state of TensorFlow programs and to visualize execution metrics and state.
An important facet of building good ML models is the ability to debug TensorFlow code when your models do not converge. Traditional debuggers fall short in this regard which is why tfdbg and TensorBoard are important skills in your toolkit. In this course, Debugging and Monitoring TensorFlow Programs, you will learn how you can adapt TensorFlow commands and library functions to help debug your programs in addition to learning specialized tools like tfdbg and Tensorboard. First, you will go over TensorFlow's special features to debug your code. Partial graph executions, tf.Print() and tf.Assert() statements, traditional Python debuggers and the tf.py_func() to interpose arbitrary Python code into your computation graph all help debug the graph build phase. Next, you will see that the specialized TensorFlow debugger tfdbg works very much like traditional Python debuggers but has the ability to step into session.run() statements and display the state of your computation graph at every step. It also has filters like the has_inf_or_nan which allows you to break at the exact point your model begins to diverge. Finally, you will be shown Tensorboard, which is a browser-based tool that helps you visualize your computation graph and view how control flows through your code. In addition, it can be used to display execution metrics and the current state of your program. After finishing this course, you will be closer to mastering TensorFlow through equipping you with important tools to build and debug robust machine learning models.


发布日期: 2018-05-01