Data Visualization Recipes in Python
MP4 | Video: AVC 1280x720 | Audio: AAC 44KHz 2ch | Duration: 1 Hour 43M | 309 MB
Genre: eLearning | Language: English
Visualization is a critical component in exploratory data analysis, as well as presentations and applications. If you are struggling in your day-to-day data analysis tasks, then this is the right course for you. This fast-pace guide follows a recipe-based approach, each video focusing on a commonly-faced issue.
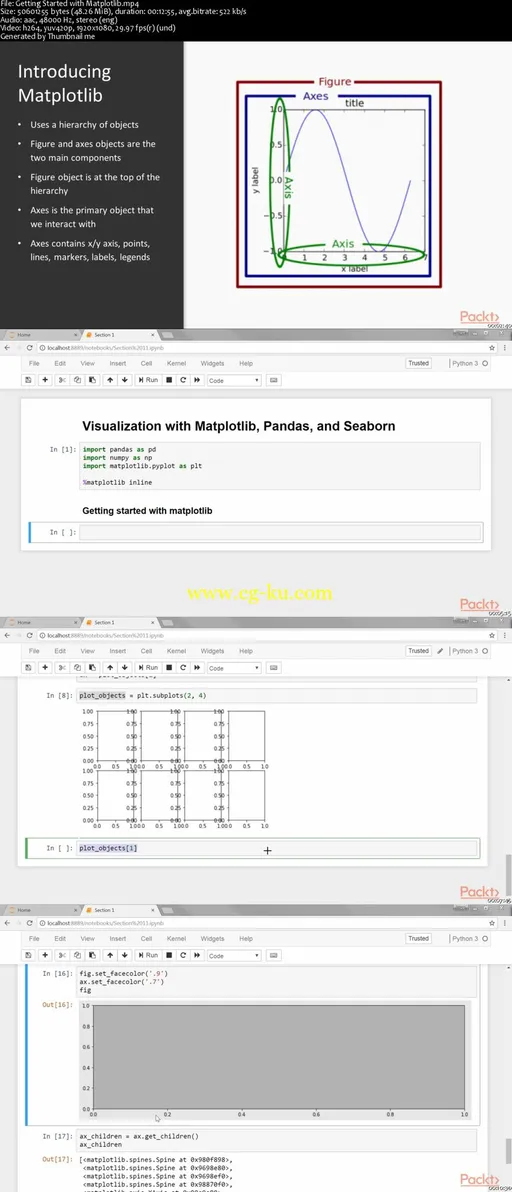
This course covers advanced and powerful time series capabilities so you can dissect by any possible dimension of time. It introduces the Matplotlib library, which is responsible for all of the plotting in pandas, at the same time focusing on the pandas plot method and the Seaborn library, which is capable of producing aesthetically pleasing visualizations not directly available in pandas. This course guides you, as if you were looking over the shoulder of an expert, through practical situations that you are highly likely to encounter.

发布日期: 2018-05-17