MP4 | Video: h264, 1280×720 | Audio: AAC, 44.1 KHz, 2 ChGenre: eLearning | Language: English + .VTT | Duration: 2 hour | Size: 860 MBThis course teaches Power BI from basic to advanced level.
What you’ll learnFundamentals of Power BI , Installation , importing data , data fields , models , designer ,Visualization component :- Table , bar chart , line chart , pie chart , map , card , stacked chart , Gauge , KPI and Funnel graph.
DAX basics , Cloning , Filter , SUM , SUMX ,FilterContext , RowContext,All , AllExcept,Inner join , left join , right jon , cross join and Summarize.
Covers Calculate columns , measures , slicer , sharing report online , pages in power BI , power query editor, modelling relationships,Import vs Direct Query and Connecting to SQL Server.
Fact , dimension tables, OLAP , OLTP Design , Star schema , Snow flake and Denormalizaed designRequirementsNo programming knowledge needed.
DescriptionLearn Power BI Step by Step:- BeginnersChapter 1:- What is Power BI?Chapter 3:- Importing Data in Power BI.
Chapter 4:- Viewing data, fields, designer and model.
Chapter 5:- Table, bar chart and line chart components.
Chapter 6:- Formatting visualization components.
Chapter 7:- Applying Analytics.
Chapter 8:- Auto filtering.
Chapter 9:- Exporting report to PDFChapter 10:- Adding a calculated column.
Chapter 11:- Adding a measure column.
Chapter 12:- Adding Pages.
Chapter 13:- Stacked bar chart, Column chart components.
Chapter 14:- Legend, Axis and Values.
Chapter 15:- Apply filters using Power Query Editor.
Chapter 16:- Line Chart, Pie chart, Map and Card Components.
Chapter 17:- Slicer component.
Chapter 18:- Modeling relationship.
Chapter 19:- Publishing and sharing report online.
Chapter 20:- The Market place.
Chapter 21:- Themes.
Chapter 22:- Revising things.
Lab 2:- Connecting SQL Server with Power BI.
Chapter 24:- Importing CSV file data in to SQL Server.
Chapter 25:- Connecting Power BI with SQL Server.
Chapter 26:- Import and Direct Query options.
Lab 3:- Line, Area, Stacke, API, Gauge and Funnel.
Chapter 27:- Line chart, Area chart and stacked charts.
Chapter 28:- Gauge charts.
Chapter 29:- KPI, Key performance indicators.
Chapter 30:- Funnel Graph.
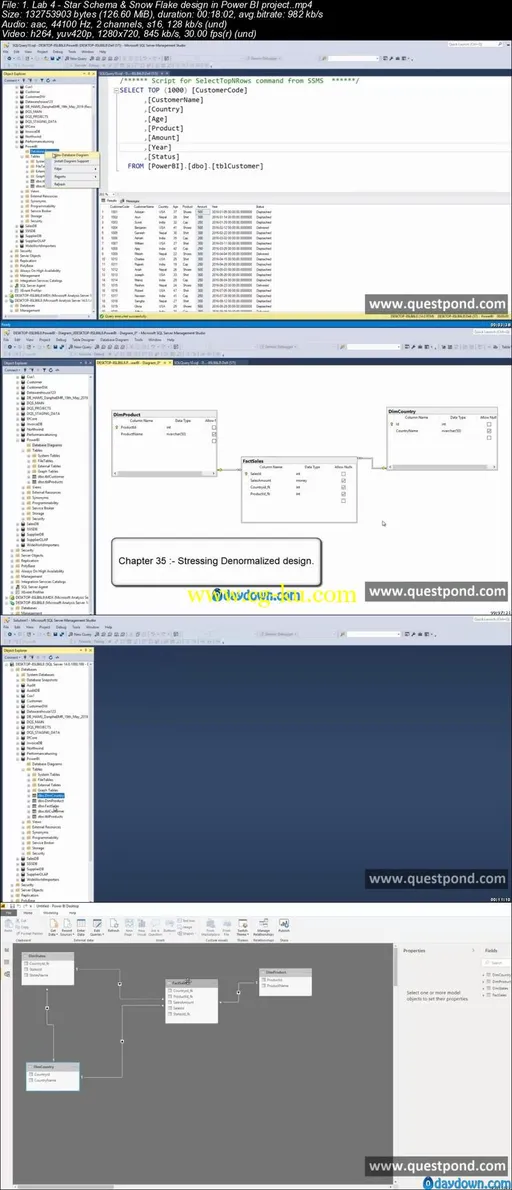
Lab 4 :- Star Schema and Snow flake designChapter 31 :- OLAP and OLTP design.
Chapter 33 :- Fact tables and dimension.
Chapter 34 :- Star schema design.
Chapter 35 :- Stressing Denormalized design.
Chapter 36 :- Redundant data issue.
Chapter 37 :- Snow flake design.
Chapter 38 :- Consuming in Power BI.
Chapter 39 :- SQL Scripts of the lessons.
Lab 5 :- DAX queriesChapter 38 :- DAX DefinitionChapter 39 :- Cloning a tableChapter 40 :- Applying filterChapter 41 :- SUM and SUMXChapter 42 :- FilterContext and RowContextChapter 43 :- Calculate :- Changing the contextChapter 44 :- Akk and AllExceptChapter 45 :- SelectColumnsChapter 46 :- Inner Join, Left Join and Cross JoinChapter 47 :- Joins with out releationshipsChapter 48 :- Summarize, Applying group byWho this course is for:People who want to learn Power BI

