本视频教程是由PluralSight机构出品的Revit模型数据色彩显示技术视频教程,时长:59分,大小:430 MB,MP4高清视频格式,教程使用软件:Revit,作者:Mathew Miller,共11个章节,语言:英语。
Revit是Autodesk公司一套系列软件的名称。Revit系列软件是专为建筑信息模型(BIM)构建的,可帮助建筑设计师设计、建造和维护质量更好、能效更高的建筑。
AutodeskRevit作为一种应用程序提供,它结合了AutodeskRevit Architecture、AutodeskRevit MEP和AutodeskRevit Structure软件的功能
PluralSight软件开发在线教育平台是美国的一家面向软件开发者的在线教育课程服务商,Pluralsight成立于2004年;专注在线下开班式的服务,直到2008年才转向在线教育。目前Pluralsight在全球100个国家服务超过20万个用户,提供超过400个在线课程。除了个人用户外,Pluralsight还提供为企业的培训服务。Pluralsight提供的课程类型包括:C#、jQuery、iOS与Android、Java、 Ruby以及包括设计、社会化媒体、NoSQL、商业智能和Salesforce等。在收费方面,Pluralsight会收取用户每月29美元,以获取其大量关于教程的视频、文章、以及其他资料等。此外,还有一项每月49美元的服务,即可以通过线下课程接受培训。
PLURALSIGHT UNDERSTAND REVIT DATA THROUGH COLOR
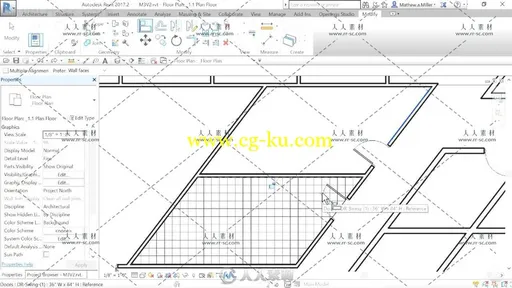
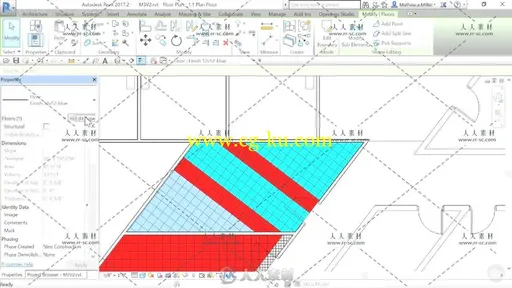
Displaying information to clients and other project stake holders in an easily understandable manner can be problematic. The best way to convey this information is through the use of simple graphics. In this course, Understand Revit Data Through Color, you’ll see how to use Revit to create graphics from data in a model. First, you’ll start with exploring several different methods and how they integrate within the workflow of a project, from schematic design program diagramming, to creating code diagrams for the authorities having jurisdiction. Next, you’ll get to see how to use area and room data to add patterns, as well as using visibility graphics to add patterns. Finally, you’ll get to use Materials System Families and Mass Objects to Color views to understand information within the model. When you’re finished with this course, you’ll have an understanding of how model managers can use these methods to perform model checks on the model to verify that it’s meeting the project’s design criteria. Software required: Revit.


发布日期: 2017-7-14